Using Linux Perf
Linux Perf provides low level CPU profiling with JavaScript, native and OS level frames.
Important: this tutorial is only available on Linux.
How To
Linux Perf is usually available through the linux-tools-common package. Through either --perf-basic-prof or
--perf-basic-prof-only-functions we are able to start a Node.js application supporting perf_events.
--perf-basic-prof will always write to a file (/tmp/perf-PID.map), which can lead to infinite disk growth.
If that’s a concern either use the module: linux-perf
or --perf-basic-prof-only-functions.
The main difference between both is that --perf-basic-prof-only-functions produces less output, it is a viable option
for production profiling.
# Launch the application an get the PID
$ node --perf-basic-prof-only-functions index.js &
[1] 3870Then record events based in the desired frequency:
$ sudo perf record -F 99 -p 3870 -gIn this phase, you may want to use a load test in the application in order to generate more records for a reliable analysis. When the job is done, close the perf process by sending a SIGINT (Ctrl-C) to the command.
The perf will generate a file inside the /tmp folder, usually called /tmp/perf-PID.map
(in above example: /tmp/perf-3870.map) containing the traces for each function called.
To aggregate those results in a specific file execute:
$ sudo perf script > perfs.outThe raw output can be a bit hard to understand so typically the raw file is used to generate flamegraphs for a better visualization.
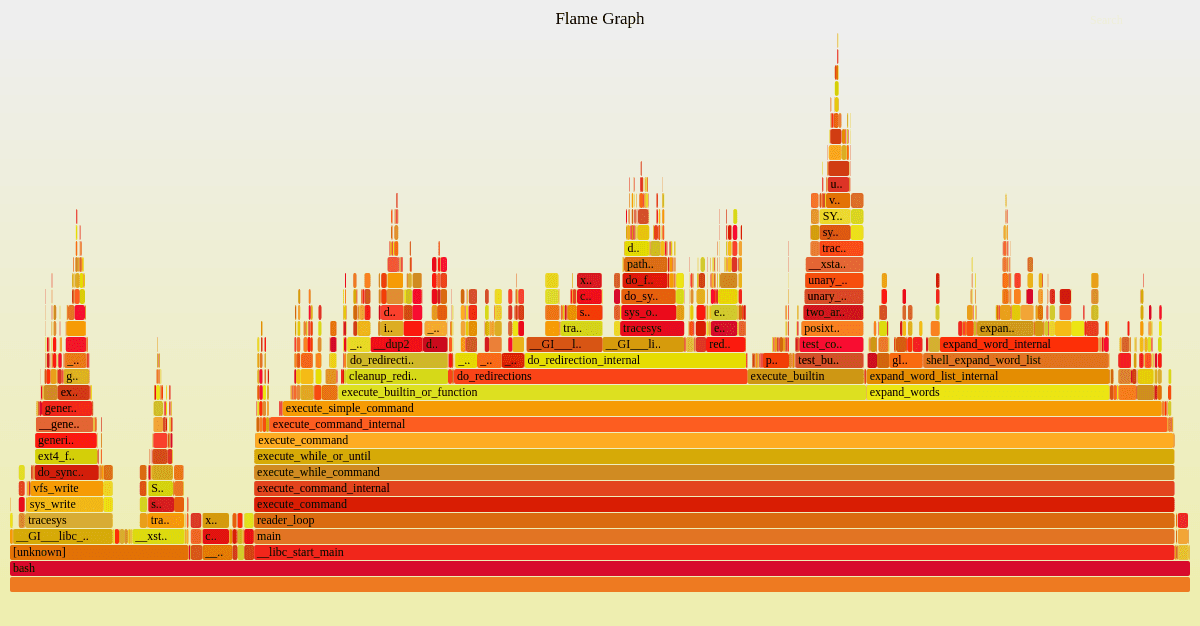
To generate a flamegraph from this result, follow this tutorial from step 6.
Because perf output is not a Node.js specific tool, it might have issues with how JavaScript code is optimized in
Node.js. See perf output issues for a
further reference.